
An annual report is one of the few documents that tells your whole story in one place: what you set out to do, what changed, who made it possible and where you are headed. Done well, it thanks supporters, reassures funders and gives your team a year of content to reuse. Done poorly, it is a long PDF nobody opens. This guide explains what to include and how to design a report people read.
Good nonprofit annual report design leads with impact, not activity. Include a short leadership letter, results and stories, a clear financial summary, donor thanks and a next step. Plan the content before the layout, visualize a few key numbers, choose the right format for your audience and make the digital version accessible.
Annual report vs. impact report
The terms overlap, and many organizations combine them. An annual report is a year-in-review covering programs, results, finances, leadership and supporters, and it emphasizes accountability. An impact report is usually shorter and focused on outcomes: what changed for the people or places you serve, often for one program, campaign or funder.
The annual report covered here is a communications piece, not a legal filing. (Some states require nonprofit corporations to file a separate “annual report” with the state, which is a different, usually short form.) The National Council of Nonprofits describes donor-facing annual reports as a tool to highlight mission and impact, thank supporters and make the case for giving, separate from the information nonprofits must disclose on request. Required public disclosure is a different matter: the IRS requires exempt organizations to make their annual information returns, such as Form 990, available for public inspection for a three-year period. Your report’s financial summary should be consistent with those filings.
What to include
- A short leadership letter: one page or less, signed by the executive director and board chair.
- Mission and year at a glance: a one-sentence mission and three to six headline results.
- Program results: outcomes, not just outputs. The number of families who moved into stable housing says more than the number of workshops you held.
- Stories: two or three short profiles with photos and quotes, used with consent.
- Financial summary: revenue by source, expenses by program, management and fundraising, and a link to audited statements or Form 990.
- Thanks: donors, funders, volunteers and partners, following your recognition policy and donors’ anonymity requests.
- Leadership: board and senior staff.
- Looking ahead: priorities for the coming year.
- Next step: one clear call to action, such as a monthly giving link.
Plan the annual report
Most report stress comes from the calendar, not the design. Work through these steps in order:
- Set the audience and goal. A report for major donors is different from one for a broad email list.
- Choose a theme, one idea that ties the year together and makes writing and design easier.
- Gather data early. Finance and program numbers take the longest to confirm, so agree on deadlines with each owner.
- Collect stories and photos throughout the year, not in the last month.
- Decide the format and length before design begins.
- Build a schedule with time for review rounds, proofreading and, for print, production and mailing.
Write for skimmers
Most readers will scan. Write so the scan still tells the story. A board member flipping through on the way into a meeting should be able to read only the headlines and captions and still know what happened this year, so lead each section with a headline that states the result and write captions that carry meaning on their own.
Keep paragraphs short and the language plain, without internal acronyms. Pull quotes from participants and partners give the eye a place to land. Then be ruthless: cut anything that does not support the theme. A tight 12 pages beats a padded 40.
Design the data
A few clear numbers have more impact than a wall of charts. Pick three to six key metrics and give each one room on the page. For each, choose the simplest chart that fits: bar charts for comparisons, line charts for trends, and pie or donut charts only sparingly, for a few parts of a whole.
Small habits keep the data honest and readable. Label values directly instead of relying on a legend, and do not use color alone to show differences; check the contrast too. Show the year and source for every figure. Icons and illustrations can support the numbers, but they should never replace them.
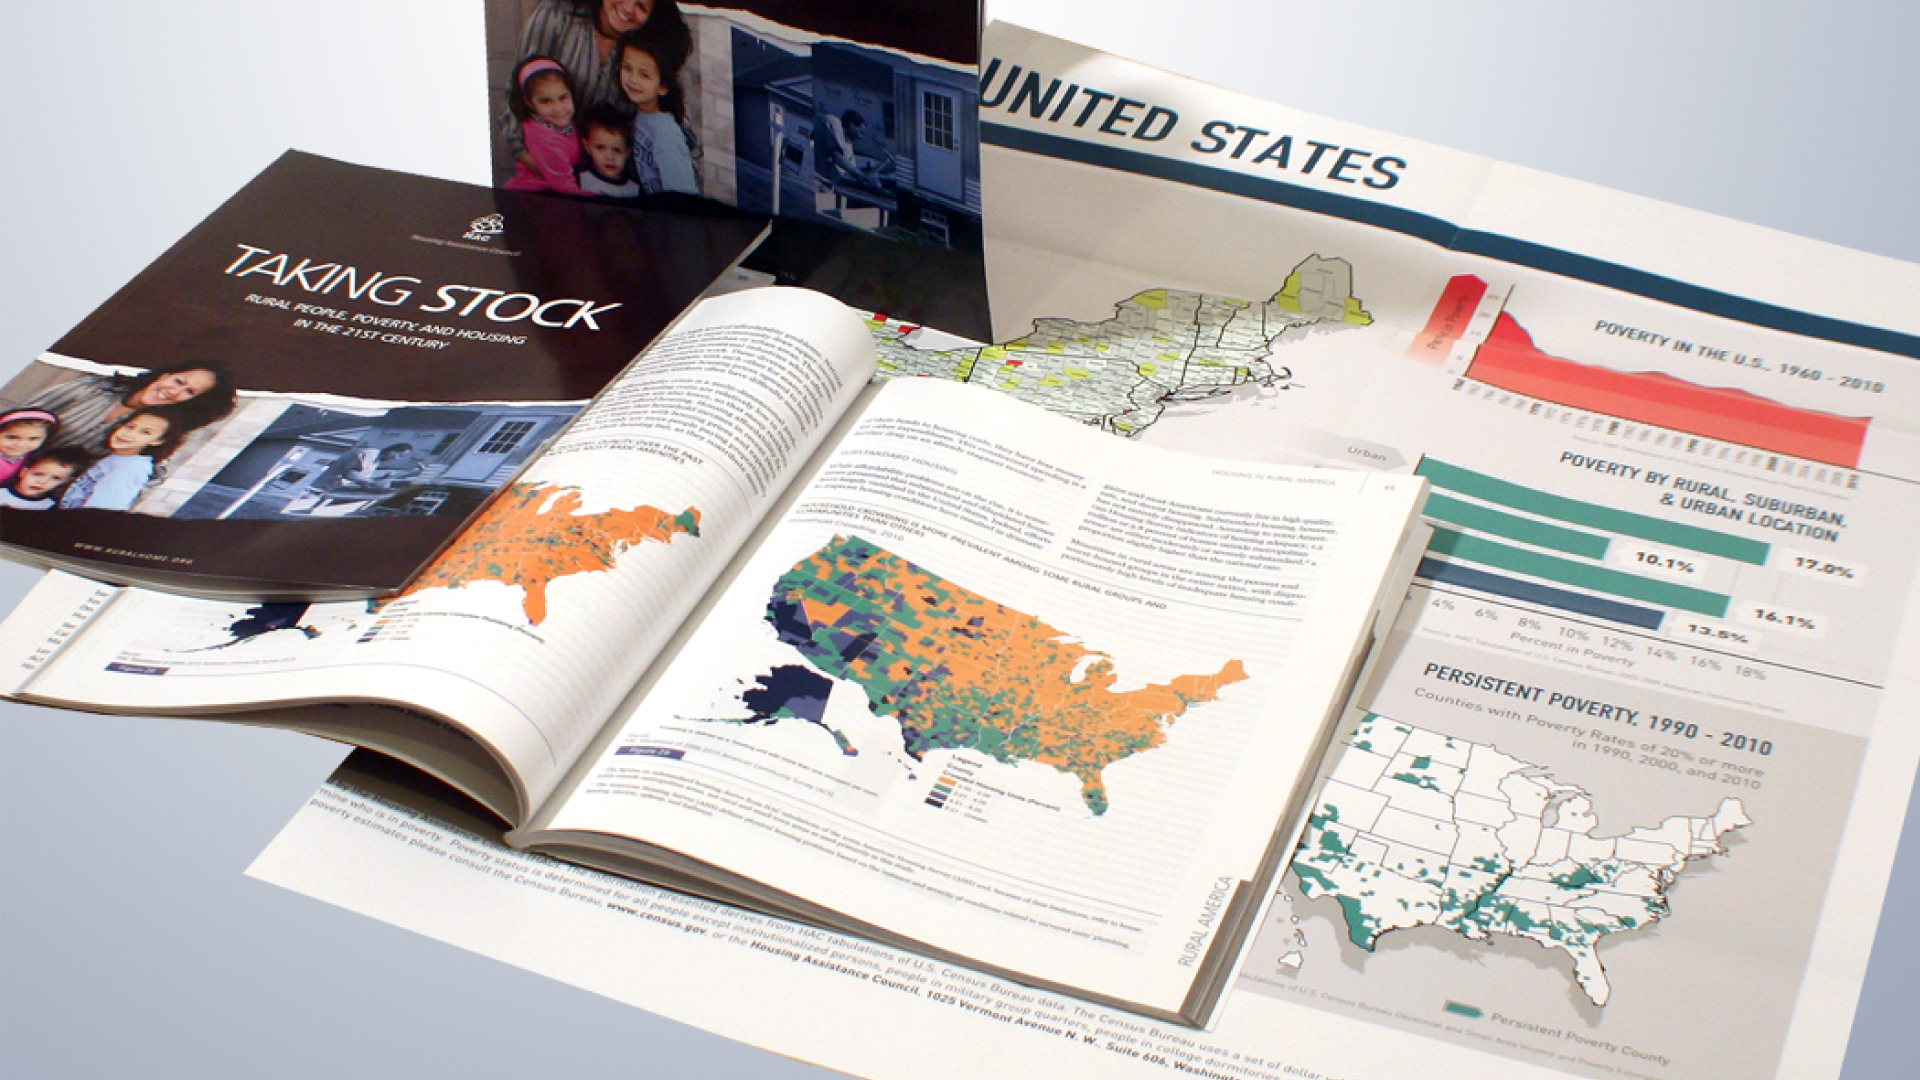
Data-heavy reports need the most care. For the Housing Assistance Council, LightMix designed Taking Stock, a print report of more than 200 pages, along with map visualizations of the data.
Photos, stories and quotes
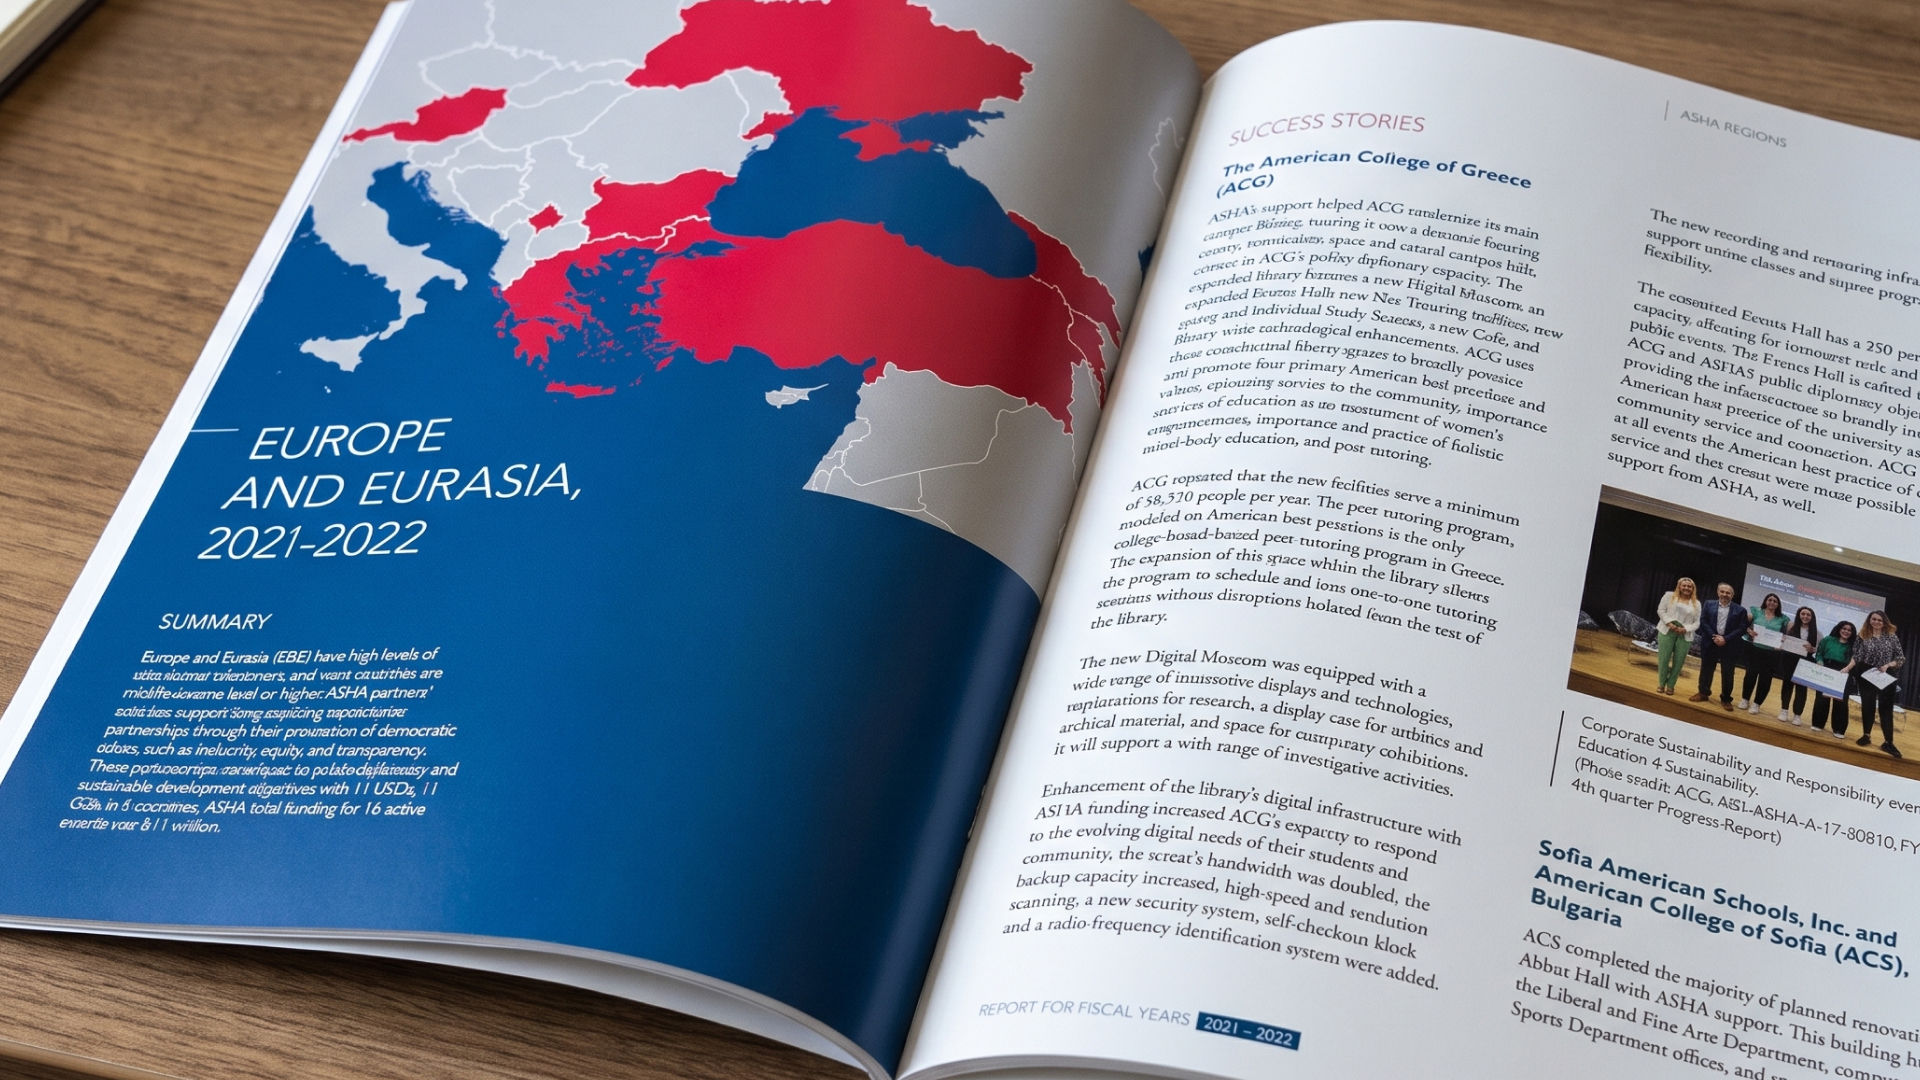
Use real photos of your work rather than stock images whenever possible, and show people with dignity and agency. Get consent for every identifiable person. A strong spread often pairs one story with one number: a participant’s quote beside the count of people the program reached that year connects the personal with the scale. Keep the whole look consistent with your nonprofit branding, from colors and type to photo style and graphic elements.
Print, PDF or web report?
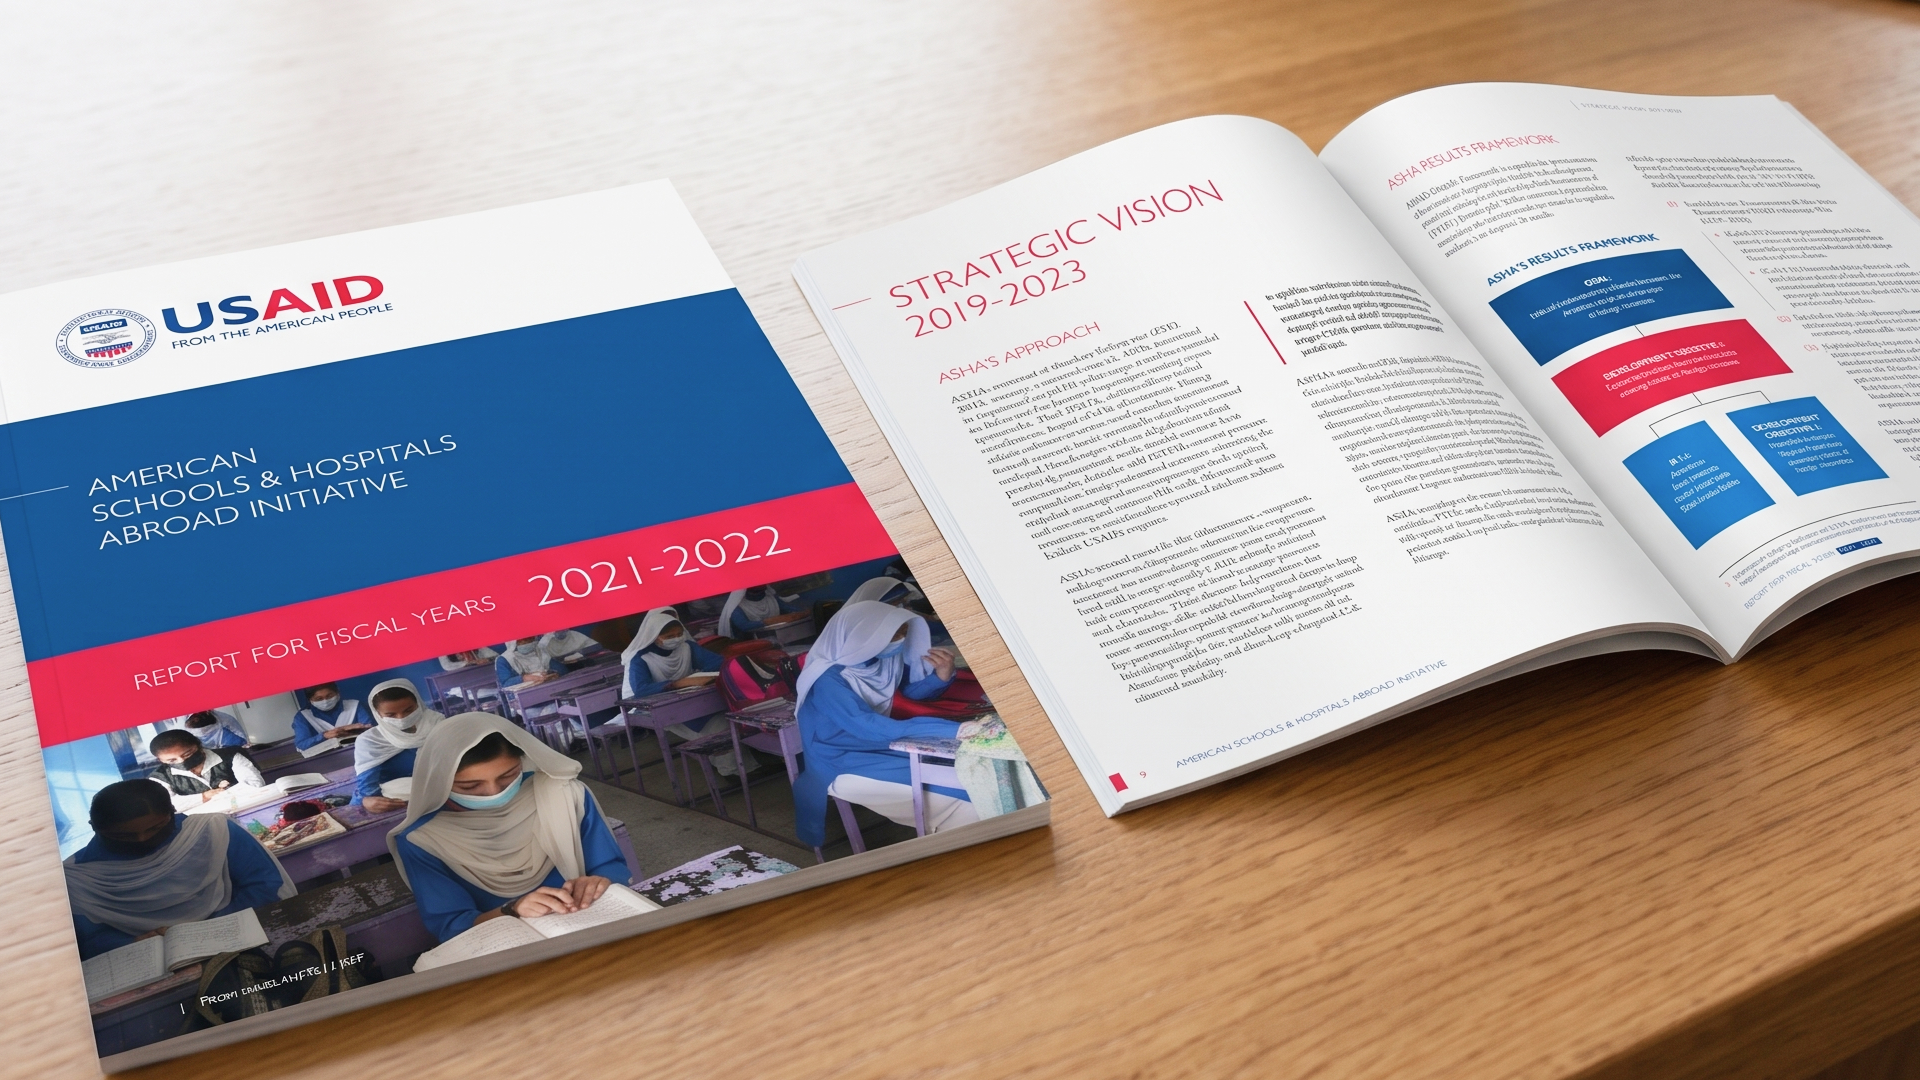
Each format has strengths, and many organizations use more than one. Print is tangible and well suited to major donors, board members and events, but it requires production time and budget. A PDF is easy to share and archive, yet hard to read on phones unless it is designed for them, and it must be tagged for accessibility.
A web page or microsite is mobile friendly, searchable, easy to update and easy to link to from email and social, and it can include video and interactive data. Short formats, such as a postcard, a one-page summary or a short video, can reach people who will never open the full report.
A practical approach: publish a web version as the main report, offer an accessible PDF, and print a shorter edition for key supporters.
Accessible report design
Annual reports often fail people who use screen readers or magnification. Build accessibility in from the first layout:
- Real text, not images of text, for headings and numbers
- Alt text on charts and photos, plus a text summary of each chart
- Tagged PDFs with headings, reading order, table structure and the document language set
- Color contrast that meets requirements in both print and digital versions
- Body text at a comfortable size, with generous line spacing
Our guide to nonprofit website accessibility explains the WCAG standards that apply to digital documents.
Distribute and reuse it
A finished report is the start of a campaign, not the end of a project. Send it first to major donors and funders with a personal note, then email the web version to your full list with one highlight in the subject line. Over the following weeks, break it into social posts, blog stories and a short video, so one year of work keeps paying off.
Make it easy to find later, too. Link it from your About page, donation page and grant proposals, and bring printed copies to events and board meetings. Track opens, page views and the gifts that follow, then use what you learn next year.
Annual Report FAQ
What should a nonprofit annual report include?
Include a short leadership letter, your mission, key results, two or three stories, a financial summary, thanks to donors and partners, board and leadership lists, priorities for next year and a clear call to action.
Is a nonprofit annual report required?
A donor-facing annual report is a communications tool, not a federal requirement. Required disclosure is separate: the IRS requires exempt organizations to make annual information returns, such as Form 990, available for public inspection. Some states also require a separate annual filing, so check your state and funder requirements.
What is the difference between an annual report and an impact report?
An annual report reviews the whole year, including programs, finances and leadership. An impact report is usually shorter and focuses on outcomes for the people or places you serve, often for a specific program or funder.
How long should a nonprofit annual report be?
Long enough to show your results and finances clearly, and no longer. Many organizations do well with a concise main report plus a one-page summary or short video for broad audiences.
Should our annual report be printed or digital?
Choose based on your audience. A web version is easiest to share and update, an accessible PDF is useful for archiving, and a short printed edition works well for major donors and events.
Many teams write the report in house and bring in a designer for layout, data visualization and production. If you want help shaping the story, designing the charts or producing print and digital editions, see LightMix’s graphic design and print services and its work with nonprofits.